.svg)

.svg)
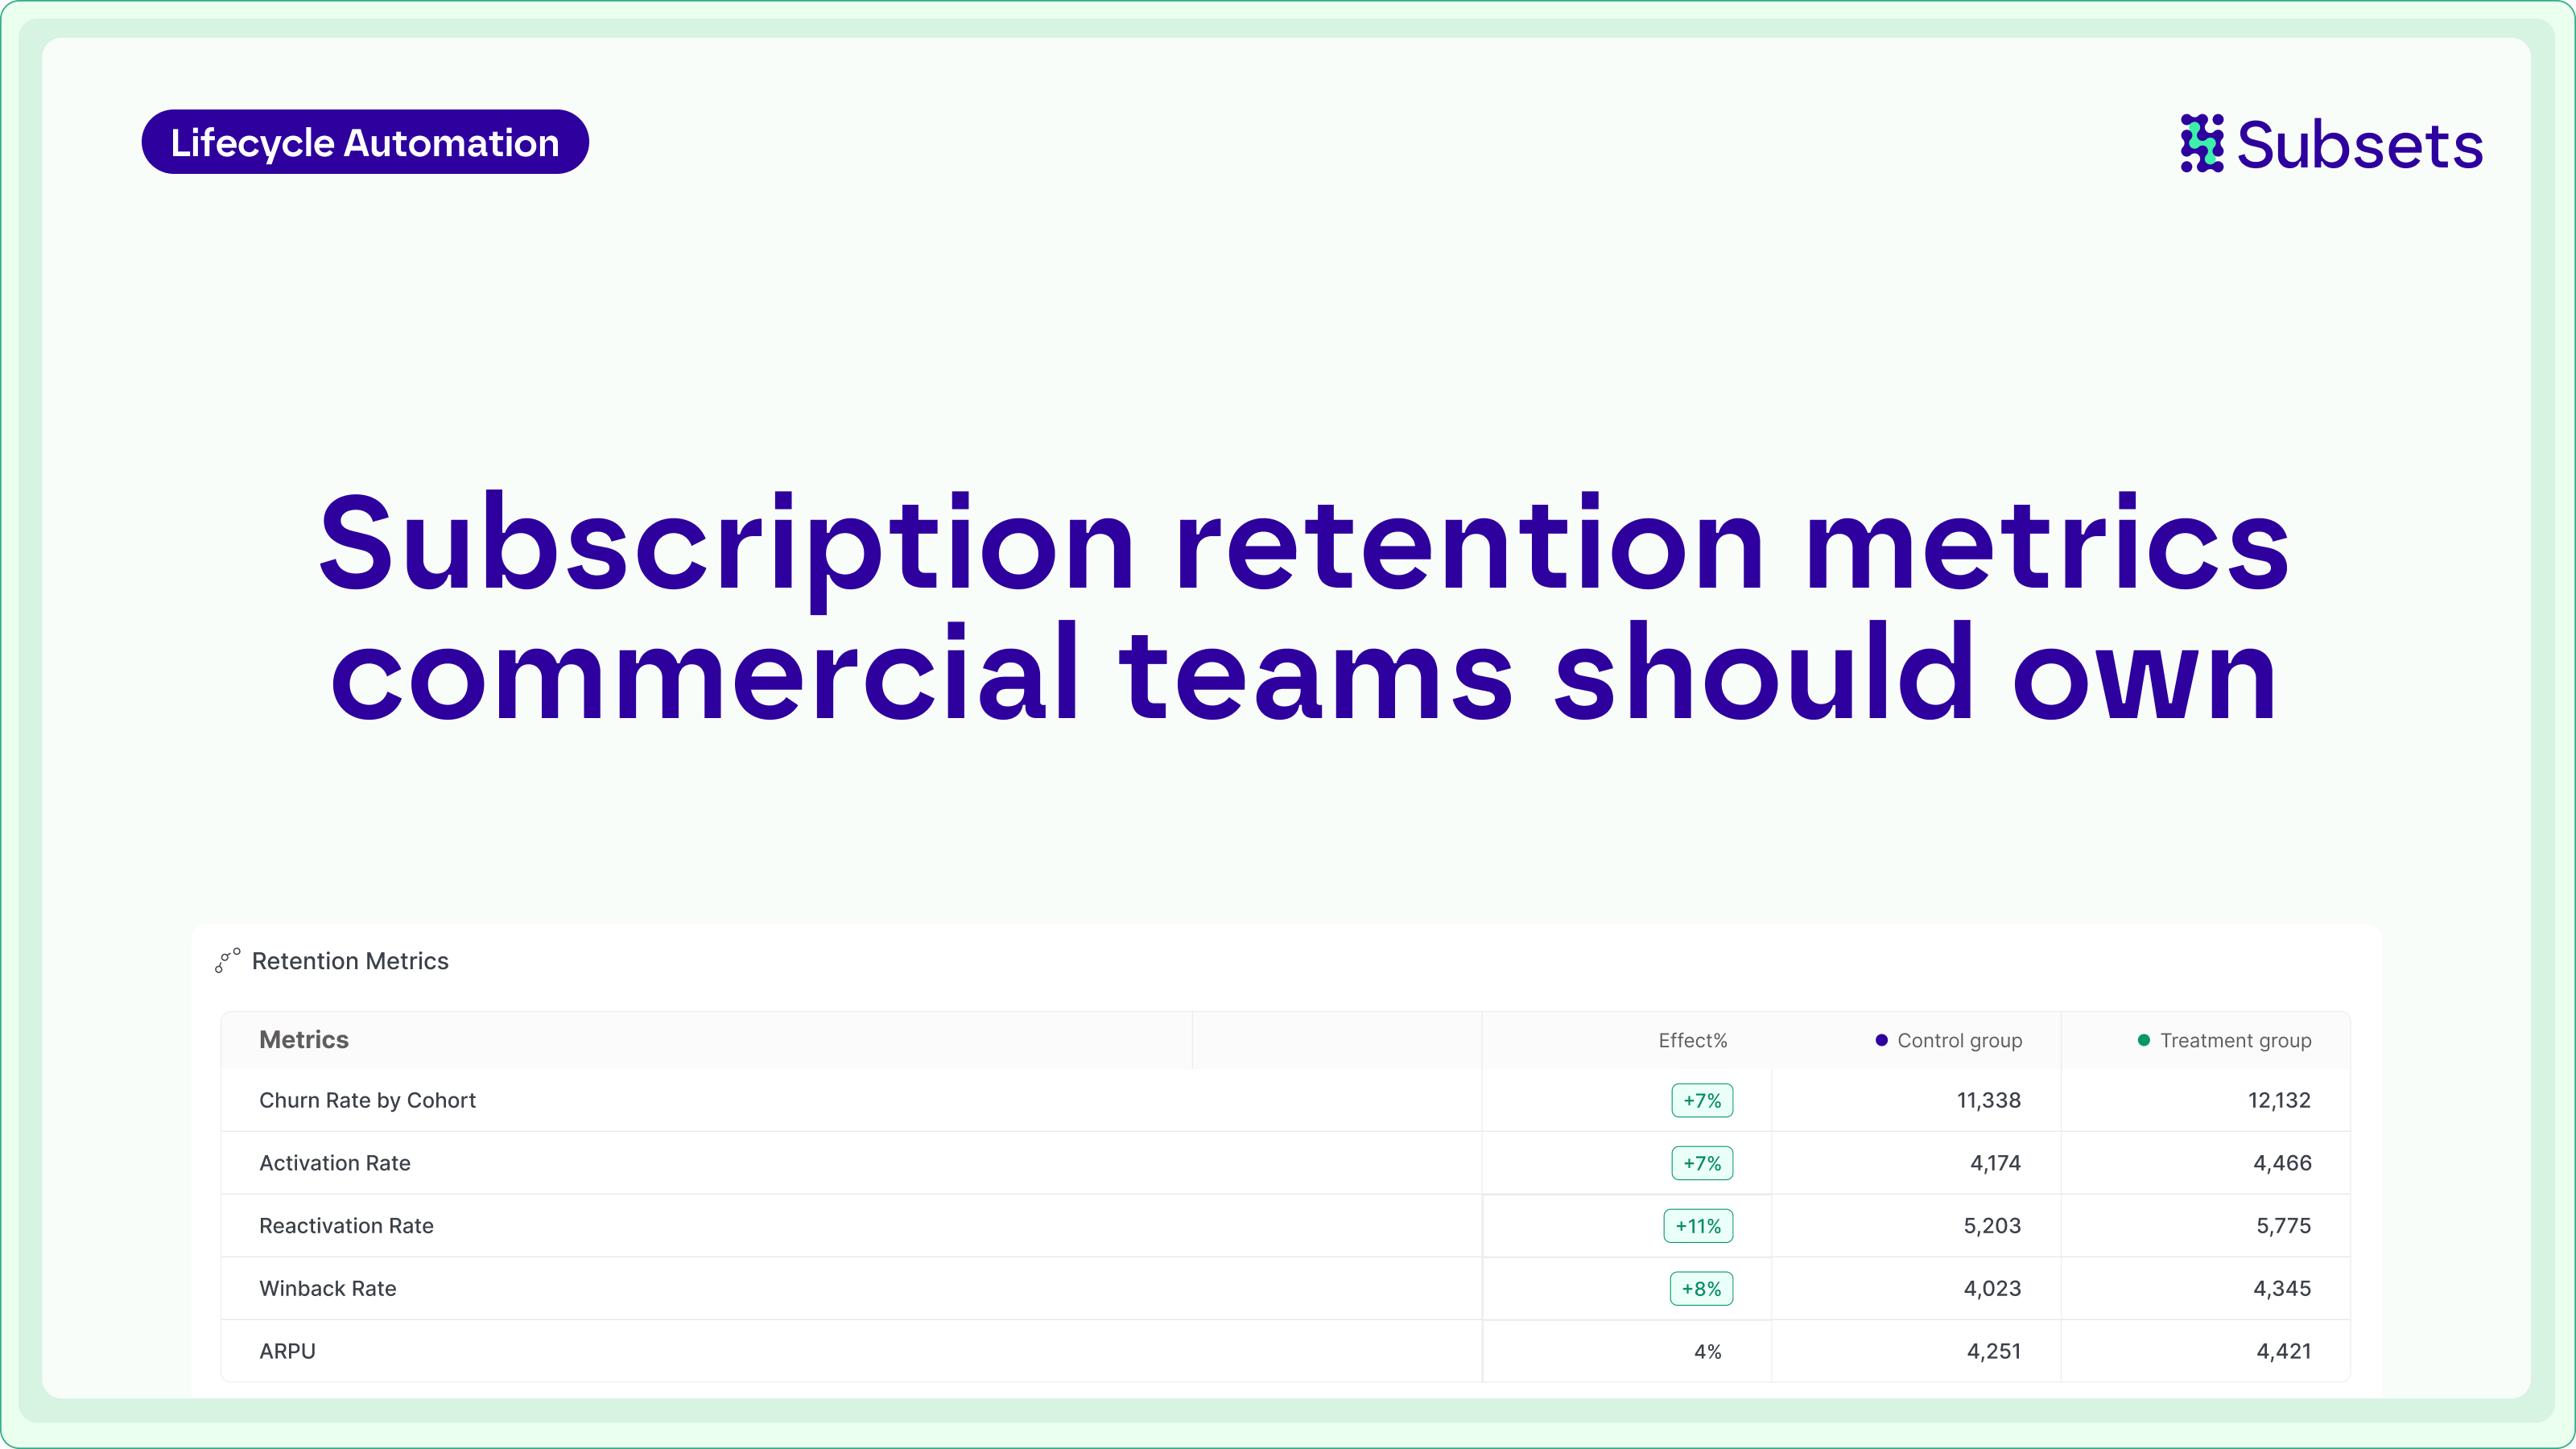
Subscription retention metrics commercial teams should own
Running a subscription retention program requires metrics that commercial teams can act on before churn shows up in revenue reporting. A CRM lead needs to know whether trial users are reaching activation. A retention manager needs to know whether a re-engagement campaign is changing subscriber behavior. A growth team needs to know where lifetime value is being lost while there is still time to intervene. These questions cannot be answered by revenue churn alone.
Retention is shaped by onboarding, engagement, personalization, pricing, and experimentation, each tied to a specific moment in the subscriber lifecycle. The metrics that help teams improve those moments are behavioral, operational, and updated often enough to guide action.
The seven metrics below form that operating layer. They show which subscribers are at risk, which interventions are working, and where the largest retention opportunities sit across the lifecycle.
1. Churn rate by cohort
Overall churn rate is a starting point. A blended number can look stable while churn among month-three subscribers is climbing, which calls for a different response than churn among annual subscribers approaching renewal.
Cohort-level churn shows where the problem actually sits.
Segment voluntary churn by acquisition source, plan type, offer type, tenure, and lifecycle stage. A spike in voluntary churn among subscribers acquired through a discounted trial may point to low-intent acquisition. A spike in the two-to-four-month window often points to a gap in the onboarding-to-engagement handoff. Cohort Retention Rate tracked by lifecycle stage turns a single number into something a team can act on.
Separating voluntary from involuntary churn matters here. Involuntary churn, driven by failed payments and expired cards, sits closer to billing operations. Voluntary churn is shaped by subscriber experience, value perception, and lifecycle communication.
2. Churn score
A churn score identifies subscribers more likely to cancel within a future window, typically 30 to 60 days, built from behavioural signals updated continuously as subscriber behaviour changes.
The strongest churn scores explain the specific behaviours driving the score alongside the overall risk level, such as narrowing content consumption, fewer sessions, reduced feature engagement, and a drop in visit frequency. That context tells the team which intervention to test and why.
Churn scores trained on the specific subscriber base, using patterns that have historically preceded churn for that business, produce more accurate segments than generic engagement metrics.
Connect every audience to an experiment. A segment of high-value subscribers with declining engagement and an upcoming renewal, paired with targeted automated outreach, is a retention program.
In media subscription environments, targeting very high-risk engaged subscribers with a specific intervention produced a +7% retention rate lift. Targeting subscribers with declining usage as a distinct audience produced +6.3% retention rate lift. The results differ by audience because the underlying behaviour differs, and churn score is what makes those audiences visible.
3. Reactivation rate
Reactivation rate measures the percentage of lapsed or dormant subscribers who return to active status. It applies across two moments in the subscriber lifecycle.
The first is dormant in-life subscribers. These are the subscribers who have stopped engaging to the point where churn risk is high. Reaching them before they make a cancellation decision is a lifecycle and CRM function, driven by AI-identified audiences and targeted outreach. The second is auto-renew reactivation. These are the subscribers who have let their subscription lapse passively and can be brought back through a campaign.
Measure re-engagement campaigns against a control group. An uplift in opens that produces no change in reactivation rate is an engagement result, not a retention result.
Audience precision shapes the result. One media subscription business saw a +4.7% retention lift from re-engaging dormant subscribers when the audience was built from behavioural signals rather than a simple inactivity threshold. A retailer running subscriber lifecycle experiments saw a +29% retention lift from engaging dormant subscribers through targeted campaigns.
Reactivation rate should be tracked separately from winback rate. Reactivation covers subscribers still within the subscription or recently lapsed. Winback covers subscribers who have formally churned. The audiences differ, the timing differs, and the interventions tend to differ too.
4. Winback rate
Winback rate measures the percentage of churned subscribers who reactivate following a targeted campaign or automated journey. The levers that move it are commercial: audience segmentation, message timing, offer design, and channel selection.
Break the winback rate down by time since churn and by cancellation reason. A subscriber who left three weeks ago for price reasons responds to a different message than one who drifted away six months ago because their engagement declined. Applying one campaign to all churned subscribers produces a flat result.
Segment by subscriber value alongside churn status. Winback rate inflated by low-value reactivations adds little to LTV.
Timing matters more than volume. In streaming environments, top-performing winback and re-engagement flows produced $50K in monthly retention lift when audiences were defined by specific behavioural segments rather than broad churn cohorts. That result comes from identifying the right subscribers at the right moment.
Track what happens after reactivation. A subscriber who reactivates and churns again within 60 days represents a recovered payment, not rebuilt engagement. Post-reactivation cohort retention rate over 90 days shows whether winback is holding.
5. ARPU
ARPU is a direct, week-to-week signal of whether subscriber value is growing or eroding. Retention is about keeping subscribers at the right plan and the right price.
ARPU averages hide the distribution. Break it down by plan type, tenure, and acquisition source to see where value is actually concentrating.
A subscriber retained through a deep discount stays on the books while ARPU quietly falls. A subscriber moved to a higher-value tier retains at a stronger rate and adds revenue at the same time. Pricing experiments run on specific subscriber audiences, identified by churn score and lifecycle stage, can produce significant movement in ARPU. In one media subscription environment, a pricing experiment on a targeted audience produced a +40% ARPU improvement on a new pricing tier and a +32% increase in customer lifetime value (CLV). Those results came from identifying which subscribers would accept a price change without churning and running a targeted experiment on that audience.
Track ARPU alongside upgrade/downgrade rate. A rise in downgrades with a stable subscriber count is ARPU erosion that will show up in revenue later. Catching it at the behaviour level gives the team time to respond.
6. Activation rate
Activation rate measures the percentage of new subscribers who reach a defined moment of first meaningful engagement within their subscription. The definition varies by product and can include reading a set number of articles, completing onboarding, using a core feature, or reaching a session threshold in the first two weeks.
A subscriber who activates early retains at a different rate from one who signs up and never meaningfully engages. The onboarding window is where that gap opens, and closing it is a commercial function shaped by lifecycle communication and content strategy.
Define activation as the behaviour that historically correlates with a subscriber staying past month three, rather than early surface actions like profile creation or a single session.
In streaming environments, targeting high-risk trial users with an activation-focused intervention produced a +10.1% retention rate lift versus a control group. Streaming hours for high-risk new subscribers increased by +296% when those subscribers received targeted engagement campaigns based on their viewing behaviour, rather than a generic onboarding sequence.
Activation rate also connects directly to trial-to-paid conversion rate. A subscriber who does activate during a trial is far more likely to convert to paid. Improving activation in the trial window tends to improve conversion, which improves cohort quality and reduces early-life churn downstream.
7. Retention rate lift
Retention rate lift measures the improvement in retention produced by a specific intervention against a control group. It is the core output metric for every experiment a commercial team runs.
Teams that run campaigns against a holdout group can tell whether retention improved because of their work or because of seasonal patterns, product changes, or subscriber mix shifts. Retention rate lift, if measured with statistical significance, tells a team whether their action caused the improvement.
Lift requires a genuine holdout group and statistical significance. Comparing a campaign result to the previous month does not produce a reliable lift measurement.
Running 20 or more concurrent lifecycle experiments, each targeting a distinct subscriber audience with a distinct intervention and measuring retention rate lift in real time, gives teams a clear picture of what works across the full lifecycle. Results across multiple audiences running simultaneously: +6.3% from subscribers with declining usage, +7% from very high-risk engaged subscribers, +4.7% from dormant subscriber re-engagement, and +14% engagement improvement from tenured subscribers with declining usage patterns. Winning experiments can then be automated, running continuously from that point.
Retention rate lift is also the metric that justifies the retention program budget. A team that can show lift, audience size, and revenue impact per winning experiment has a much stronger case for investment than one reporting campaign volume and click rates.
Media case study
The Daily Mail, with 250,000 subscribers, faced increasing churn without clear visibility into which segments or behaviors were driving cancellations. To address this, the team implemented a strategy focused on churn score monitoring, cohort-level tracking, and activation metrics to pinpoint risks, discovering that the problem was concentrated in the two-to-four-month subscriber window.
The strategy shifted from broad campaigns to over 20 concurrent, targeted experiments using AI-identified audiences. These interventions produced significant positive results, including retention rate lifts ranging from +4.7% for dormant users to +14% for tenured subscribers. Additionally, a targeted pricing experiment delivered a +40% ARPU improvement and a +32% increase in CLV, allowing the team to automate winning interventions across the lifecycle.
Bottom line
Churn score, activation rate, reactivation rate, winback rate, ARPU, and retention rate lift by acquisition source are the operational layer that makes retention a programrather than a number. They show which subscribers are at risk, which interventions are working, and where in the lifecycle the most improvement is available.
Platforms like Subsets help commercial teams build this layer by identifying AI-driven behavioural audiences, running lifecycle experiments without engineering support, measuring retention rate lift in real time with statistical significance, and turning winning interventions into always-on automations across the full subscriber lifecycle. Book a demo with Subsets to see how it works.
Frequently asked questions
What is a good subscription retention rate for consumer media companies?
A good subscription retention rate depends on the subscription category, billing model, acquisition source, and subscriber tenure. Consumer media companies should evaluate retention using cohort retention rate by lifecycle stage rather than a single blended number. A strong retention rate improves over time at key stages, particularly after onboarding, first renewal, and reactivation.
What is the difference between Gross Revenue Retention and Net Revenue Retention?
Gross Revenue Retention (GRR) measures how much recurring revenue is retained from existing subscribers before any expansion revenue. Net Revenue Retention (NRR) includes expansion from upgrades, upsells, and cross-sells. GRR shows how well the business is protecting existing revenue. NRR shows whether existing subscribers are also growing in value.
What is a Churn Score and how is it used?
A Churn Score is a predictive metric that identifies subscribers more likely to cancel within a defined future window, typically 30 to 60 days, based on behavioural signals. Commercial teams use it to build targeted audiences, run retention experiments, and trigger automated lifecycle campaigns before cancellation occurs. The most useful churn scores explain which specific behaviours are driving risk.
What metrics predict subscriber churn before it happens?
The strongest leading indicators are behavioural signals, including declining Activation Rate, reduced session frequency, narrowing content or feature usage, and weakening engagement in the weeks before a renewal. These signals look different at each lifecycle stage. A new subscriber with no activation in week two is a different problem from a tenured subscriber whose engagement dropped after consistent use. Churn Score models trained on the specific subscriber base surface these patterns before they reach cancellation.
How do commercial teams measure subscription retention?
Commercial teams should track Churn Score, Activation Rate, Reactivation Rate, Winback Rate, ARPU, Retention Rate Lift from experiments, and Cohort Retention Rate by acquisition source. Together these metrics show which subscribers are at risk, which interventions are producing results, and where in the lifecycle retention can be improved.